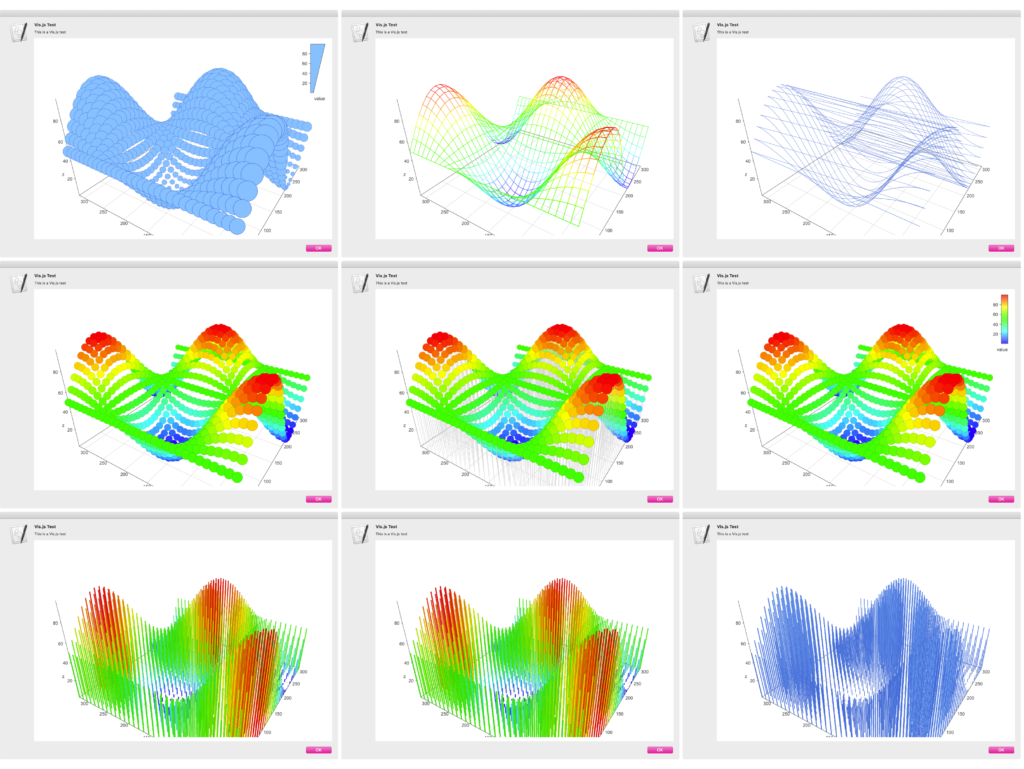
アラートダイアログ上に作成したWkWebViewでvis.jsのGraph3dを用いて3Dグラフを表示するAppleScriptです。
本Scriptは単に三角関数の計算値をプロットするものなので、そのまま実用レベルというわけではありませんが、vis.jsがこのように利用できることを示す実証コードにはなっていると思います。
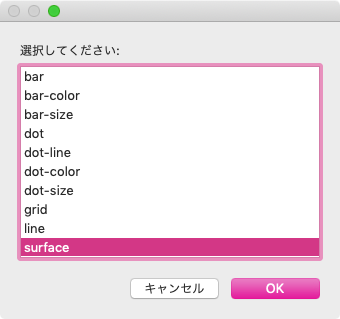
実行すると、グラフの表示タイプを聞いてくるので、
選択すると、グラフを表示します。ドラッグで回転、マウスのスクロールホイールでズーム制御を行います。
まいどまいど、代わり映えしないWkWebViewの表示コードを掲載するのもどうかと思い、その部分はライブラリとしてまとめておきました。きちんとAppleScript側のオブジェクトでパラメータを指定できるレベルまで落とし込めば、JavaScript部分もライブラリに押し込んで「display chart」のようなsdefつきライブラリに仕立ててもいいのかもしれません。
–> Download 3dGraphDialog.zip (Script Bundle with AppleScript Libraries)
| AppleScript名:アラートダイアログ上にWebViewでvis.jsを用いて3Dグラフを表示.scptd |
| — – Created by: Takaaki Naganoya – Created on: 2020/06/20 — – Copyright © 2020 Piyomaru Software, All Rights Reserved — use AppleScript version "2.4" — Yosemite (10.10) or later use framework "Foundation" use scripting additions use webD : script "webDialogLib" property NSString : a reference to current application’s NSString set aSel to choose from list {"bar", "bar-color", "bar-size", "dot", "dot-line", "dot-color", "dot-size", "grid", "line", "surface"} if aSel = false then return set aaSel to contents of first item of aSel –https://visjs.github.io/vis-graph3d/docs/graph3d/index.html set myStr to "<!DOCTYPE HTML> <html> <head> <title>Graph 3D demo</title> <style> body {font: 16pt arial;} </style> <script type=\"text/javascript\" src=\"https://cdnjs.cloudflare.com/ajax/libs/vis/4.21.0/vis.js\"></script> <script type=\"text/javascript\"> var data = null; var graph = null; function custom(x, y) { return (Math.sin(x/50) * Math.cos(y/50) * 50 + 50); } // Called when the Visualization API is loaded. function drawVisualization() { // Create and populate a data table. var data = new vis.DataSet(); // create some nice looking data with sin/cos var steps = 30; // number of datapoints will be steps*steps var axisMax = 314; var axisStep = axisMax / steps; for (var x = 0; x < axisMax; x+=axisStep) { for (var y = 0; y < axisMax; y+=axisStep) { var value = custom(x, y); data.add({ x: x, y: y, z: value, style: value }); } } // specify options var options = { width: ’900px’, height: ’600px’, style: ’%@’, showPerspective: true, showGrid: true, showShadow: false, keepAspectRatio: true, verticalRatio: 0.6 }; // create a graph3d var container = document.getElementById(’mygraph’); graph3d = new vis.Graph3d(container, data, options); } </script> </head> <body onload=\"drawVisualization();\"> </body> </html>" set aString to NSString’s stringWithFormat_(myStr, aaSel) as string set paramObj to {myMessage:"Vis.js Test", mySubMessage:"This is a Vis.js test", htmlStr:aString, jsDelimiters:{"<script type=", "</script>"}, viewSize:{920, 620}} webD’s displayWebDialog(paramObj) |
More from my site
(Visited 620 times, 1 visits today)


