アラートダイアログ上にWkWebViewを作成し、その上でChart.jsによる円グラフを表示するAppleScriptです。
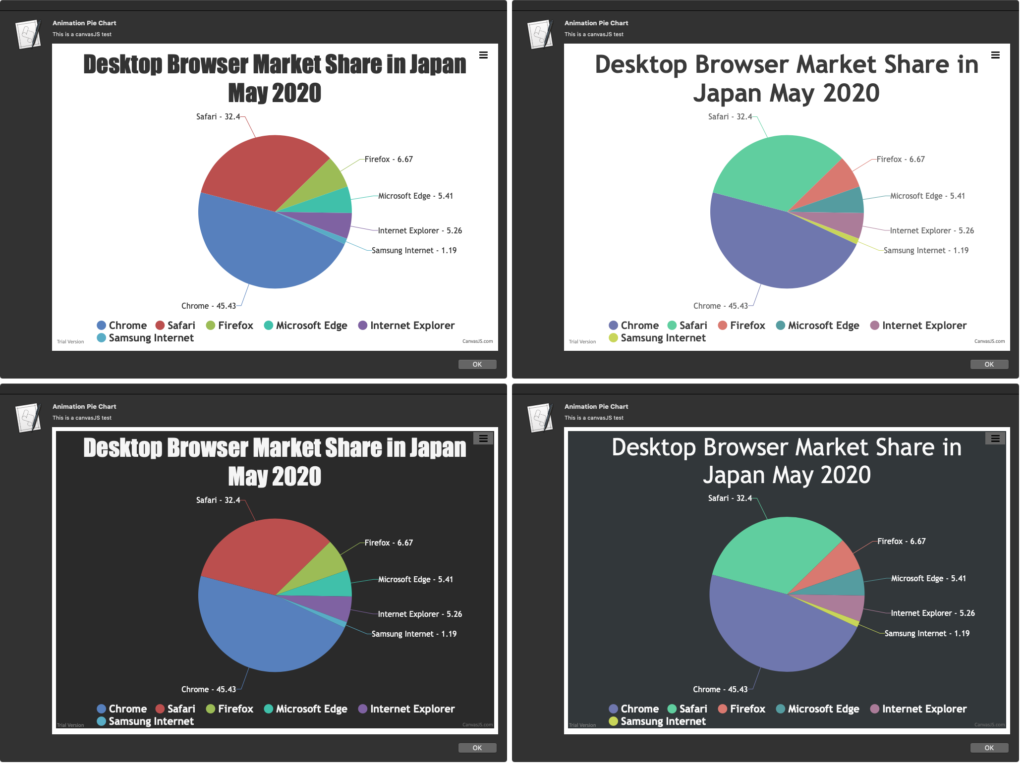
–> Download chartJSPieChartDemo.scptd(Script Bundle with Lirbrary and HTML)
Chart.jsは、ダイアグラムやフローチャートなどを描画するJavaScriptのライブラリです。割とデータのカスタマイズがしやすい感じです。
| AppleScript名:chartJSでアニメーション円グラフをダイアログ表示 v2.scptd |
| — – Created by: Takaaki Naganoya – Created on: 2020/06/26 — – Copyright © 2020 Piyomaru Software, All Rights Reserved — use AppleScript version "2.4" — Yosemite (10.10) or later use framework "Foundation" use scripting additions use webD : script "webDialogLib" set aRes to first item of (choose from list {"light1", "light2", "dark1", "dark2"} with prompt "Choose theme") set aList to {{y:45.43, label:"Chrome"}, {y:32.4, label:"Safari"}, {y:6.67, label:"Firefox"}, {y:5.41, label:"Microsoft Edge"}, {y:5.26, label:"Internet Explorer"}, {y:1.19, label:"Samsung Internet"}} set myTitle to "Desktop Browser Market Share in Japan May 2020" –https://canvasjs.com/javascript-charts/pie-chart-legends/ set mePath to path to me set resPath to (mePath as string) & "Contents:Resources:index.html" set myStr to (read (resPath as alias) as «class utf8») as string set aJsonStr to array2DToJSONArray(aList) of me set aString to current application’s NSString’s stringWithFormat_(myStr, aRes as string, myTitle, aJsonStr) as string set paramObj to {myMessage:"Animation Pie Chart", mySubMessage:"This is a canvasJS test", htmlStr:aString, jsDelimiters:{"<script>", "</script>"}, viewSize:{900, 620}} webD’s displayWebDialog(paramObj) on array2DToJSONArray(aList) set anArray to current application’s NSMutableArray’s arrayWithArray:aList set jsonData to current application’s NSJSONSerialization’s dataWithJSONObject:anArray options:(0 as integer) |error|:(missing value) set resString to current application’s NSString’s alloc()’s initWithData:jsonData encoding:(current application’s NSUTF8StringEncoding) return resString end array2DToJSONArray |
More from my site
(Visited 392 times, 1 visits today)


