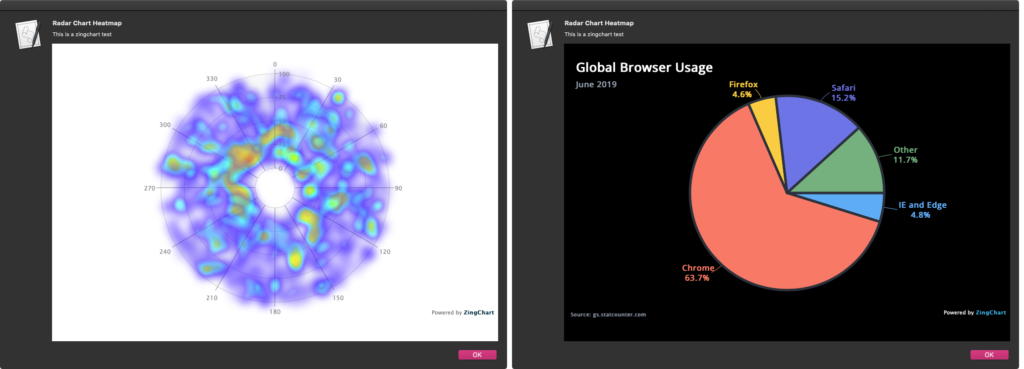
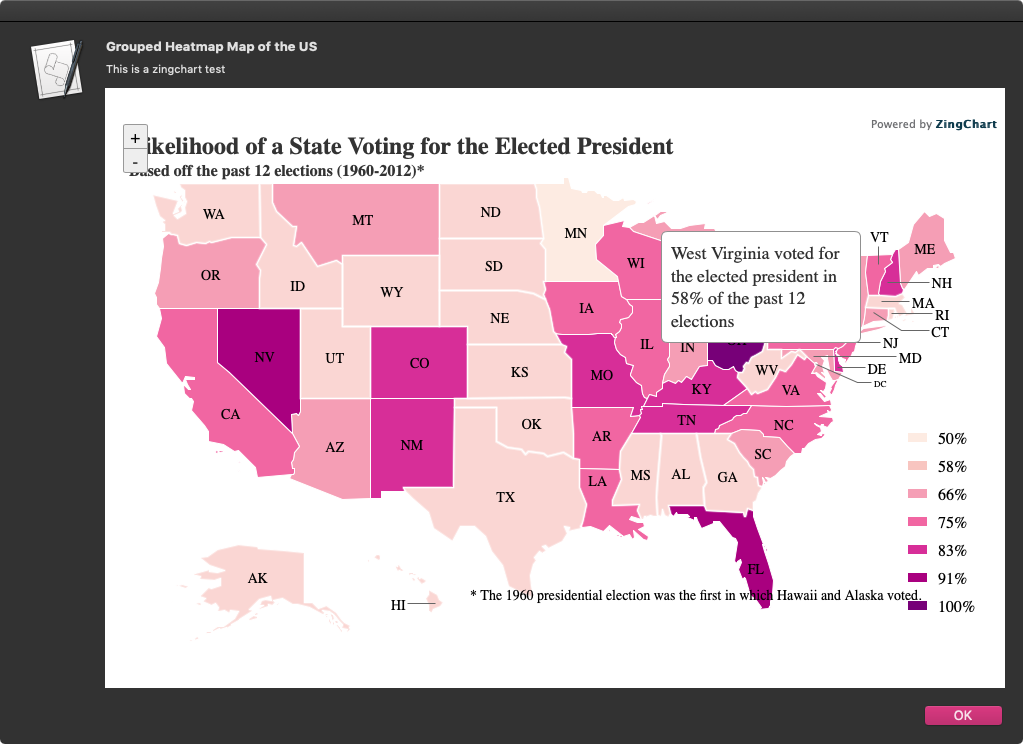
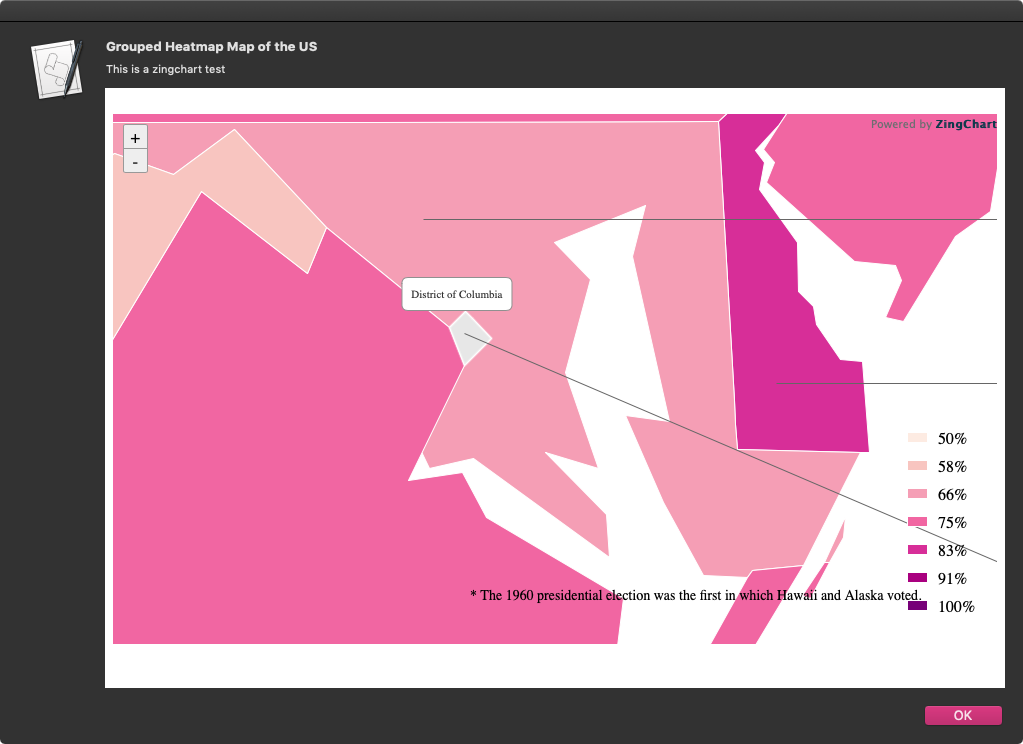
アラートダイアログ上にWkWebViewを貼り付けて、その上でZingChartによるヒートマップを表示するAppleScriptです。
–> Download zingchartDisp (Script Bundle with AppleScript library and html)
さすがにHTMLのコードが長々と掲載されるのはいかがなものかと考え、htmlを外部ファイルに追い出してみました。
ZingChartは商用のJavaScriptライブラリですが、フリーでも利用できます。フリーで利用する場合にはチャート中に「Powered by ZingChart」の表示が入るようです。
index.html中からデータを外部に追い出せていませんが、データを外部から供給するようにすれば、AppleScriptで処理した結果を表示する部品として活用できることでしょう。

▲ほかにもいろいろありますが、ZingChartはセンスがいい上にサンプルにフルHTMLが掲載されていて分かりやすいですね。ただ、自分が表示させたいデータを突っ込んで表示を試みるとうまく行かないケースが多い
| AppleScript名:ZingChart.jsでヒートマップをダイアログ上に表示.scptd |
| — – Created by: Takaaki Naganoya – Created on: 2020/06/23 — – Copyright © 2020 Piyomaru Software, All Rights Reserved — use AppleScript version "2.4" — Yosemite (10.10) or later use scripting additions use webD : script "webDialogLib" –https://www.zingchart.com/gallery/grouped-heatmap-of-united-states set mePath to path to me set resPath to (mePath as string) & "Contents:Resources:index.html" set myStr to read (resPath as alias) as «class utf8» set paramObj to {myMessage:"Grouped Heatmap Map of the US", mySubMessage:"This is a zingchart test", htmlStr:myStr, jsDelimiters:{"<script>", "</script>"}, viewSize:{900, 600}} webD’s displayWebDialog(paramObj) |
More from my site
(Visited 269 times, 1 visits today)


